
Monitoring in the cloud

By identifying the problem in time, monitoring can prevent many troubles and save companies considerable losses. However, setting up a proper monitoring strategy is not as trivial as it may seem at first glance. Especially in the cloud, monitoring is not free, which is why we should approach its deployment responsibly. Let’s see how to do it.
Jakub Procházka
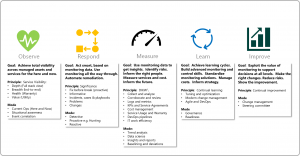
Monitoring strategy
Companies either enter the cloud with an existing monitoring system that can be integratedwith the public cloud, or go the route of purely native tools from public cloud providers.
Often, however, people imagine it too simply, where a box is ticked in the cloud and monitoring is instantly solved. Unfortunately, it’s not that easy. Monitoring is a complex service that needs to be considered holistically (similar to backups, which I wrote about in a previous article).
First of all, the monitoring itself should always be preceded by a monitoring strategy, which should be developed by the company before entering the public cloud (or at least at the beginning of its adoption).
Zdroj:https://docs.microsoft.com/en-us/azure/cloud-adoption-framework/strategy/monitoring-strategy
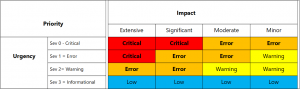
The monitoring strategy should then imply everything that will be part of the monitoring. In addition to defining the scope, the company should not forget to clarify the following:
- identify the criticality categories of each incident (see the following figure),
- take into account who will be the target recipient of the notifications,
- take into account who will be the consumer of the logs,
- what data we want to visualize.
Source: https://docs.microsoft.com/en-us/azure/cloud-adoption-framework/strategy/monitoring-strategy
The monitoring tool itself would be useless if nobody looks at the logs and the notifications end up in spam or get lost in the flood of notifications.
At the same time, the monitoring strategy will give us a specific monitoring framework. This avoids the unnecessary costs associated with monitoring and logging data that has no real benefit.
I often encounter the fact that a customer has turned on logging for everything and is now unpleasantly surprised by an ever-increasing invoice. In such cases, it is necessary to take a step back and revise and consolidate existing solutions.
You can read more about the monitoring strategy, for example, in the official cloud adoption framework from Microsoft.

Source: https://www.commitstrip.com/en/2019/05/20/monitoring-everything
Monitoring in the cloud – what are the options?
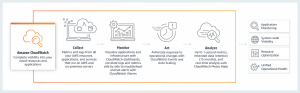
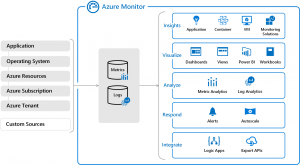
The most widely used monitoring services in the cloud include Azure Monitor and AWS Cloudwatch. These services can then be connected to other tools, including third-party tools such as Datadog or Splunk.
Both core services enable monitoring not only of resources running in their cloud environment, but also outside of it – most often on-premise. They therefore support a hybrid scenario. Integration with the on-premise and data collection is then done using agents.
Source: https://aws.amazon.com/cloudwatch
Monitored data
We divide the collected data into two basic groups, namely logs and metrics.
Metricsare numerical values that characterize a service at a specific time. They can often be displayed in various charts and rendered in near real-time.
An example of a metric might be the CPU utilization of a virtual server or the responsiveness of a web application. Some basic metrics are collected automatically in the cloud, while others require the installation of an agent or extension for the service.
Metrics have a default retention set, for example in Azure it is 93 days for platform metrics. If we want to keep the metrics longer, it is necessary to “cast” the metrics to a paid repository.
Source: https://docs.microsoft.com/en-us/azure/azure-monitor/overview
Logs are standard structured text records typically containing a timestamp, type of information (warning, error, critical, etc.) and the record itself. For the retention of logs it is necessary to store them in a special repository, in the case of Azure it is Log Analytics, which is considered to be a kind of central point not only of logs, but of monitoring in general.
Main areas of monitoring in the cloud
In general, cloud monitoring can be further divided into the following four categories:
- Provider platform monitoring
- Activity and audit logs
- Monitoring IaaS and PaaS
- Application monitoring
Platform monitoring
Platform monitoring provides information about the availability of the cloud environment and informs about the unavailability of services not only in a given region. It also notifies us in advance of planned work or shutdowns. In the context of Microsoft, this service is called Azure Health and at Amazon it is called AWS Health.
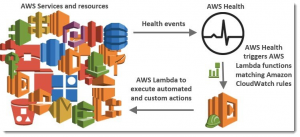
Source: https://aws.amazon.com/blogs/aws/announcing-the-aws-health-tools-repository
Activities and audit logs
Furthermore, we should also log the activities performed in the cloud and other related audit logs described by my colleague Martin Gavanda in the previous article. In addition to the already mentioned Azure Monitor and AWS Cloudwatch, other services such as Azure Activity log and AWS X-Ray are used here.
Monitoring IaaS and PaaS
This type of monitoring is usually of most interest to users because, unlike the platform, client liability comes into play here, according to the shared liability model(which we described in an earlier article).
Monitoring plays an important role here precisely because it draws attention to possible deficiencies, errors or incidents in the managed environment. An example could be the failure of one of the servers (IaaS VMs), its inappropriate utilization or the unavailability or overload of the PaaS database.
For PaaS services, the monitoring options offered may vary depending on the specific type of service. In the context of IaaS and PaaS monitoring, it is worth mentioning an Azure tool called Diagnostic settings, which contains activity logs, resource logs and provides detailed diagnostics and audit information related to Azure resources.
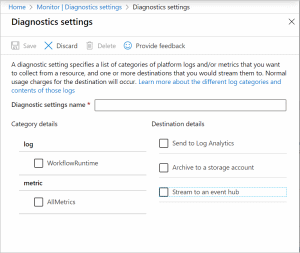
Source:https://docs.microsoft.com/en-us/azure/azure-monitor/essentials/diagnostic-settings
Application monitoring
Going one level deeper, we get into the OS and application layer. Thanks to extensions and agents we can see much more details, such as application logs, custom application logs, details of operating system logs and other services running on our VM/EC2.
With application monitoring, it is also possible to monitor services running outside the environment, for example, on-premise.
Pro aplikační monitoring AWS nabízí Amazon CloudWatch Application Insights a Microsoft zase Azure Application Insights. Integration of these tools is usually easy, in some cases codeless application monitoring is also supported for selected programming languages (you can read more about it, for example, in the official Microsoft documentation here).
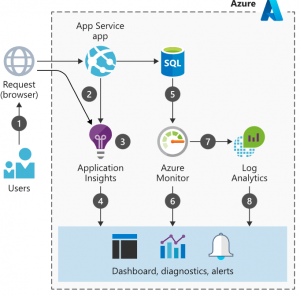
Application monitoring greatly helps the development and DevOps team and can greatly help improve the user-friendliness of the application. It is possible to track the details of individual sessions, users, their movements in the application, including errors, tracking returns and much more.
How to grasp the costs and deployment of monitoring?
Monitoring can be a significant item on the final invoice. In order to minimize this impact, we must not forget a few other useful tips in addition to the monitoring strategy:
- Use data sampling
- Limit the amount of data using a data cap or daily volume cap
- Benefit from volume discounts
- When debugging a large volume of logs, enable a higher log level only for the time necessary for debugging
Deployment of monitoring can be automated (or at least partially) for example by using the appropriate tags or in the case of IaaC in a deployment script.
Monitoring compliance with company requirements can also be monitored using various policies that monitor compliance with monitoring rules for individual sources and can alert us to any deficiencies.
Automation and notifications
Individual incidents can be responded to in different ways. If an alert is triggered, it is possible to send an email, SMS, dial a phone number, create a ticket, send a notification to the application or directly run an automation scriptthat will try to correct it. Of course, these actions can be combined, even in terms of recipients, i.e. different groups that we want to notify in different ways.
For example, if the web server on the VM is unavailable, it is possible to send an email to the admins, create a ticket and try to automatically restart the web service on the VM (apache/nginx/IIS). If this resolves the issue, it can be logged in a ticket and emailed to the admins who can investigate this non-urgent issue further later during business hours. If the problem persists, escalate the ticket and send an SMS or call the hotline.
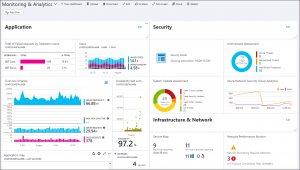
Visualization
Administrators and developers can greatly facilitate (and especially speed up) their work by instantly rendering the collected data. The most important data can be visualized on the so-called. dashboards, which are essentially dashboards that provide a quick overview of the environment or application being monitored. In this way, we often get important information about what is happening in our environment at a glance.
Custom views can be made using query queries according to the current need and can also be pinned to your own dashboard.
Examples of what such dashboards can look like in both AWS and Azure are shown in the following images. On purpose – can you tell which one belongs to which provider?

Source: Official website of the provider
Source:Official website of the provider
And that’s not all…
There are two other special types of monitoring that I haven’t mentioned today. It belongs to the special category ofsecurity monitoring and cost monitoring. Each of these categories is a separate topic for its own article and it is possible that we will get to them in the future.
And how do you monitor yours? In a hybrid environment, would you rather go the single tool route or monitor the cloud separately? Let me know in the comments.
Now you can start looking forward to the next article by my colleague Martin Gavanda on the topic of keys. If you’re interested in other topics related to the cloud, check out our Cloud Encyclopedia series – a quick guide to the cloud.
This is a machine translation. Please excuse any possible errors.